Education
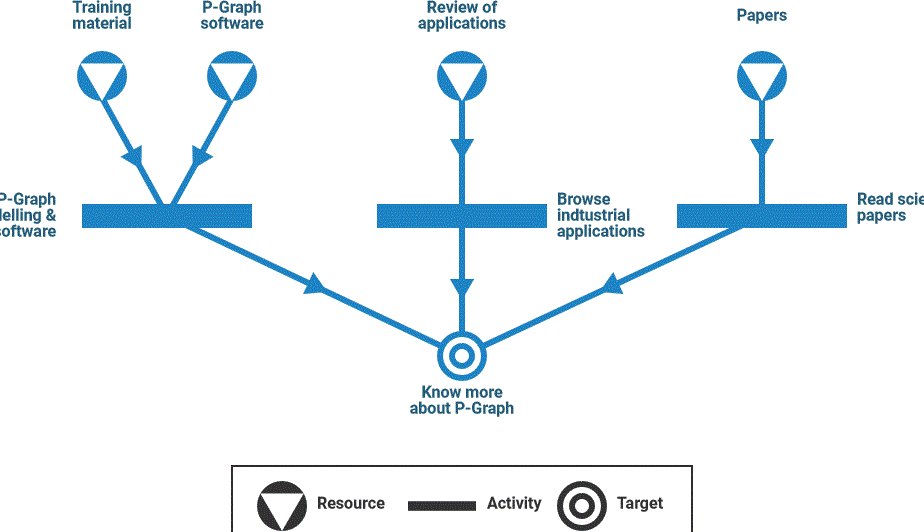
P-Graph is a bipartite graph. One set of nodes (horizontal bars) represents the operating units and the other (solid circles) the material streams.
Research
Refered Journal and Book Articles of the Centre for Advenced Process Optimization.
Business
P-Graph can be used on different industrial and economical areas.