Education
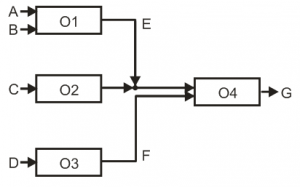
Conventional Representation of a process structure.
P-Graph is a bipartite graph. One set of nodes (horizontal bars) represents the operating units and the other (solid circles) the material streams. There is no arc between two operating units. Relations of the operating units are realized through material streams, i.e., an operating unit is connected to another if one of them consumes a material produced by the other. In P-Graph representation there are arcs from each input material (stream) to the operating unit consuming it and from each operating unit to its output materials (streams).
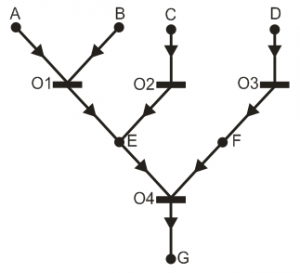
P-Graph represenation of the process structure.
From Dia's homepage: "Dia is a GTK+ based diagram creation program for Linux, Unix and Windows released under the GPL license. Dia is roughly inspired by the commercial Windows program 'Visio', though more geared towards informal diagrams for casual use. It can be used to draw many different kinds of diagrams. It currently has special objects to help draw entity relationship diagrams, UML diagrams, flowcharts, network diagrams, and many other diagrams. It is also possible to add support for new shapes by writing simple XML files, using a subset of SVG to draw the shape." How to install Dia Basic steps in Dia How to draw objects in Dia How to draw lines and connectors in Dia How to save or export images in Dia A complete P-Graph in Dia
The aim of process structures is to produce certain materials. Design alternatives are different process structures resulting in the same product. If a merial is produced by more than one operating unit, it can be produced by one, by an other, or any combination of them. For example, material E can be produced by operating unit O1, O2, or both of them. Based on this information the algorithms using P-Graph can take into account all the candidate design altenatives. In a P-Graph inputs to an operating unit are necessary inputs, e.i., each of them have to be available in order to use the operating unit. For example, material E and F are both necessary inputs to operating unit O4, that is why operating units O2 and O3 are not alternatives to each other.
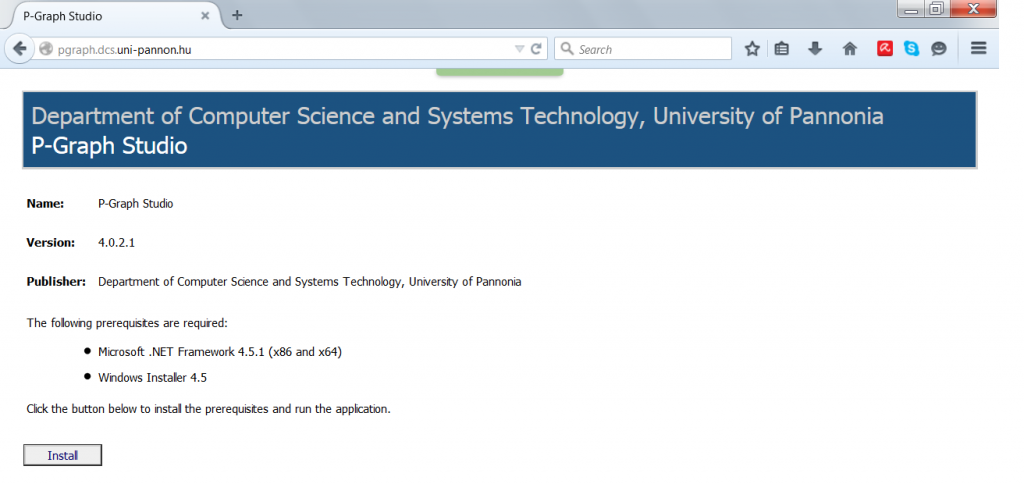
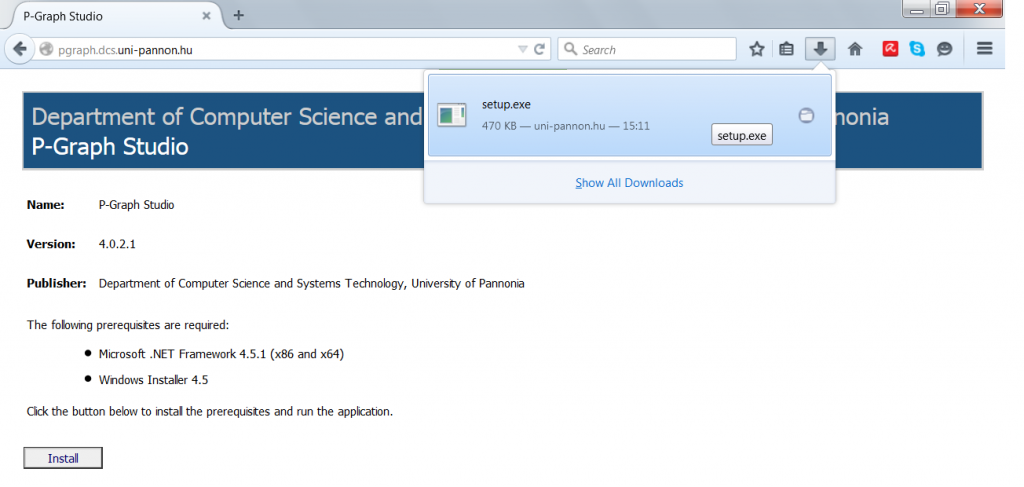
- To download the software, first You have to visit http://pgraph.dcs.uni-pannon.hu/ and click on the Install button.
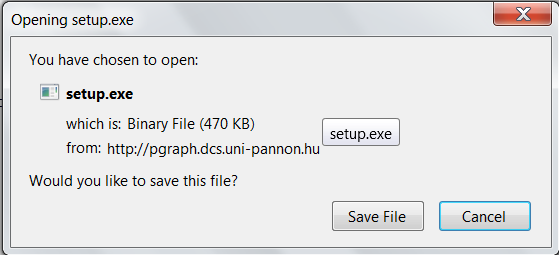
- Then You should select Save File to download it on Your computer.
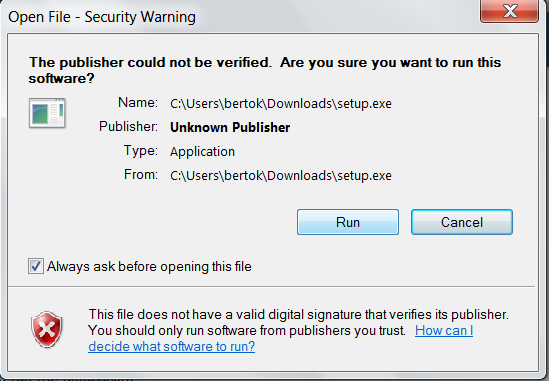
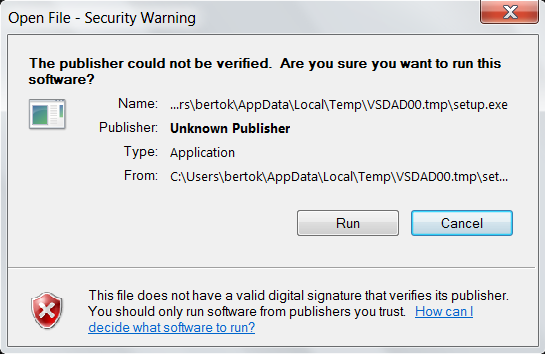
- After the download You may click on Setup.exe, this will start the installation process.
- Since the publisher is University of Pannonia, You can trust the publisher and click Run.
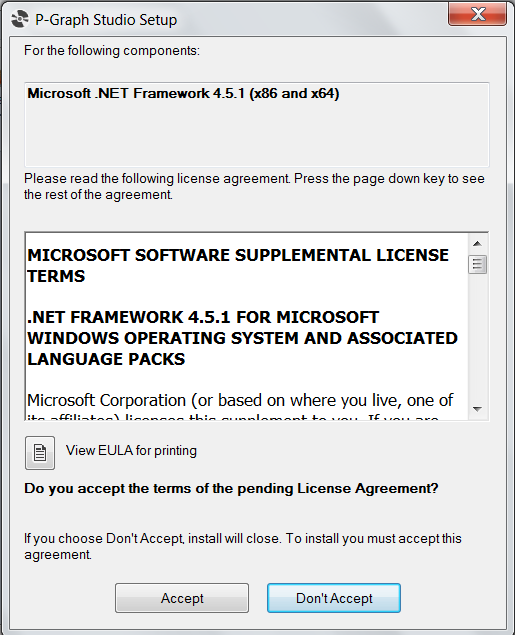
- Next You have to accept the terms of License Agreement.
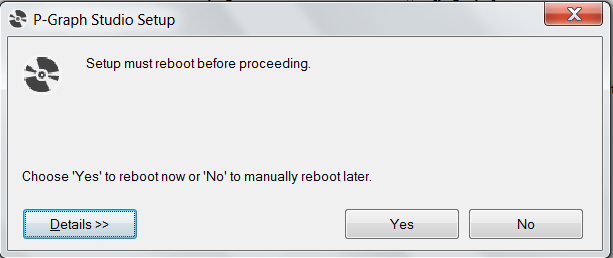
- A reboot will be needed to continue.
- If the question in connection with the publisher is dropped again, click Run again.
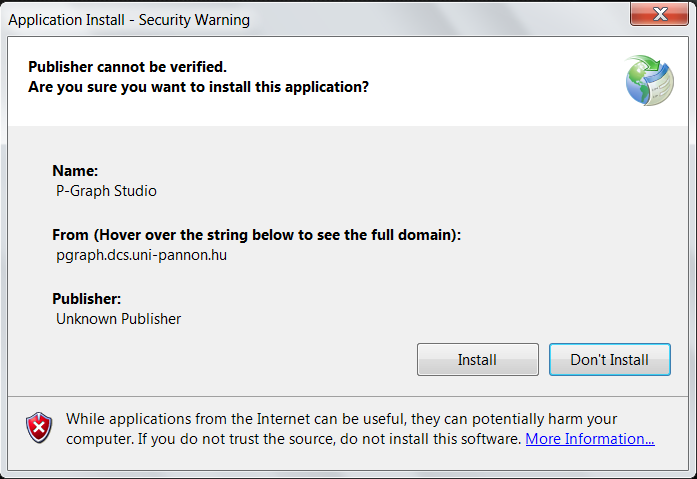
- The question is also asked considering the name of the software and the source of it.
- The opening screen of the PNS Studio can be seen below.
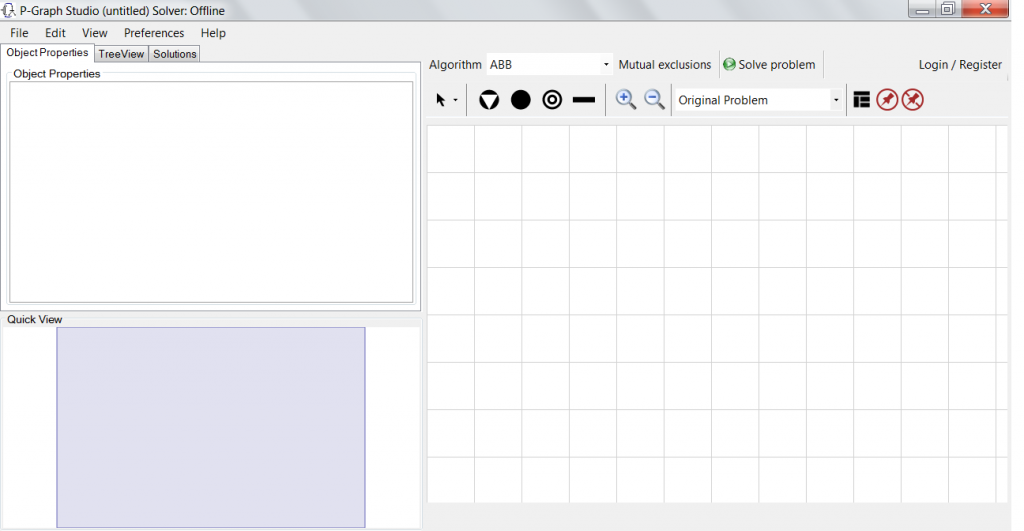
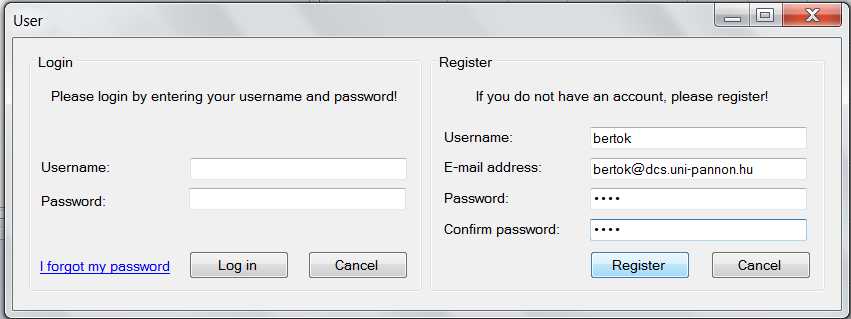
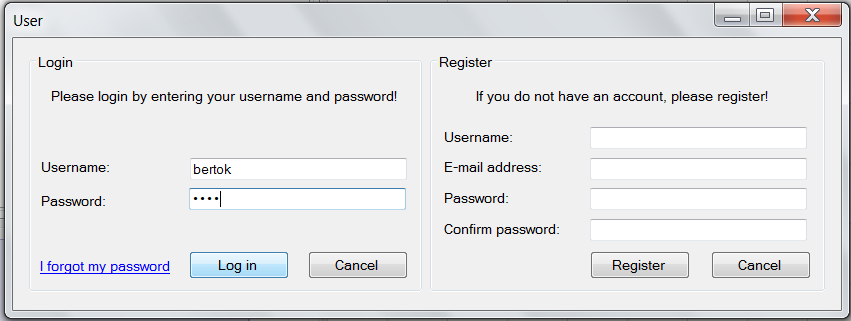
- To register or login You have to click on the Login/Register button visible on the right up corner.
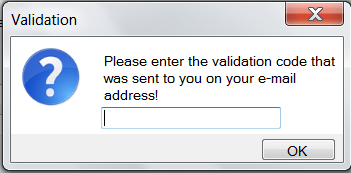
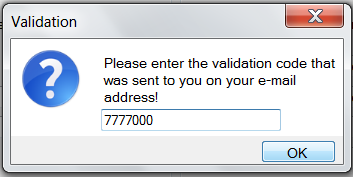
- Next You have to enter the validation code which comes onto the email address given earlier.
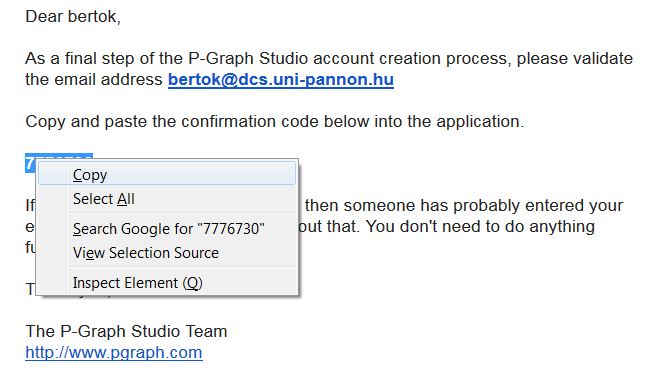
- The validation code can be found in the email. It has to be copied on the clipboard by clicking with right mouse and click Copy.
- Paste it into the Validation form.
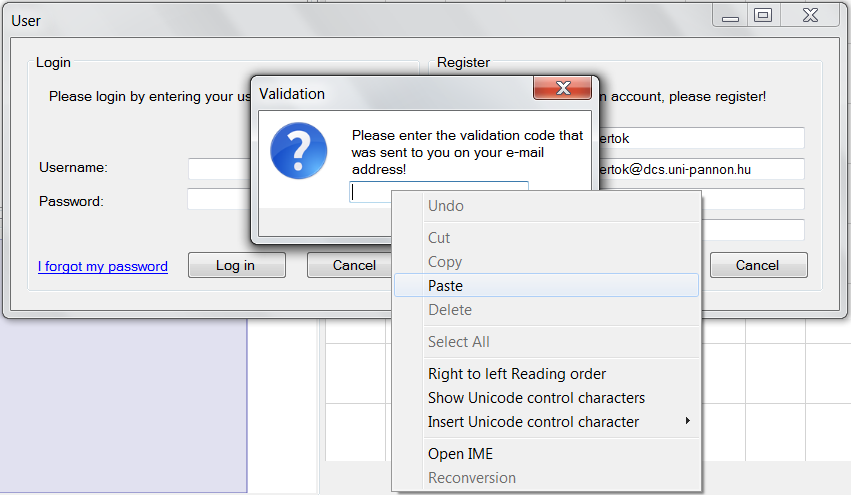
- Click OK.
- This is the end of the registration phase. You can click OK.
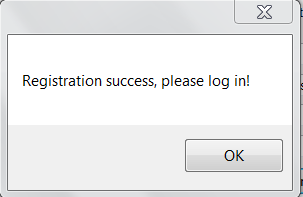
- Finally You can log in with the registrated user name and password.
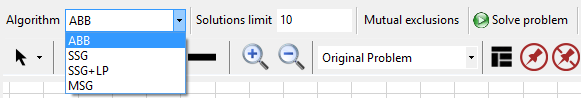
If we want to determine the optimal solution, we have to set the most properties of the considered graph. Let us take a look at the following example with the given properties:
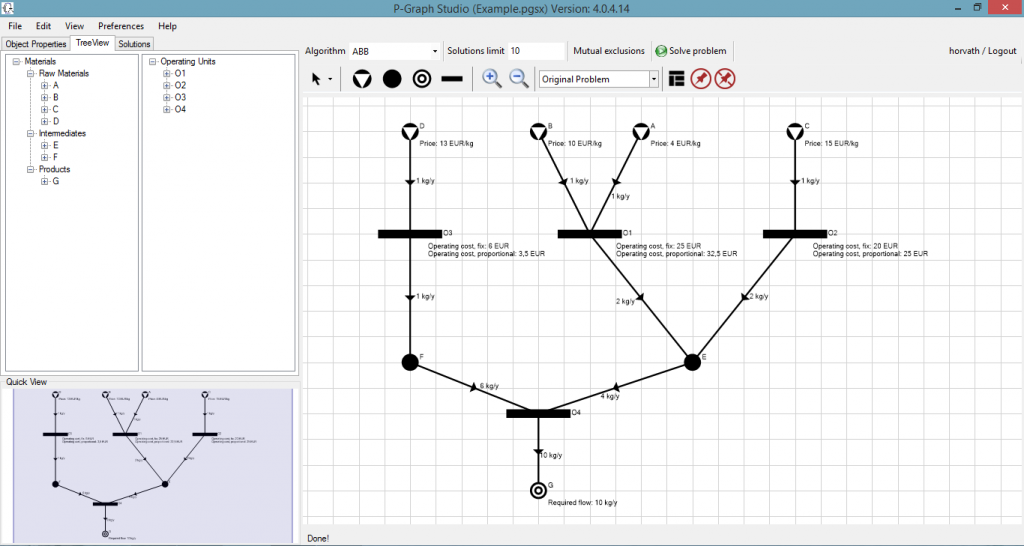
Next, You should choose an algorithm and enter the maximum number of solutions (Solutions limit). We also can give a set of mutual excluded operating units by hitting the “Mutual exclusions” button. Then just simply click on the “Solve problem” button to start the solver.
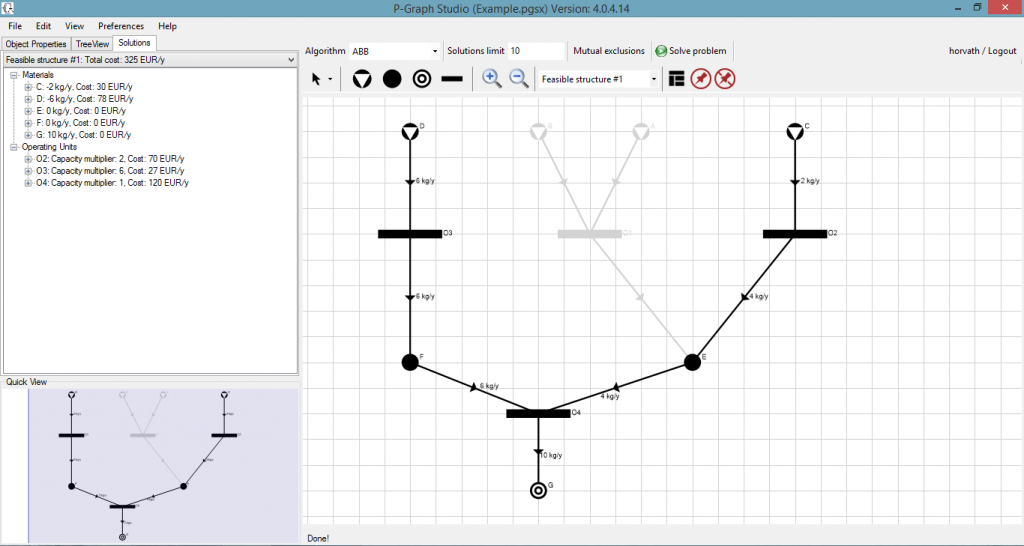
After a complete execution You should select the “Solution” tab and click on the drop-down menu, where You find all the solutions.
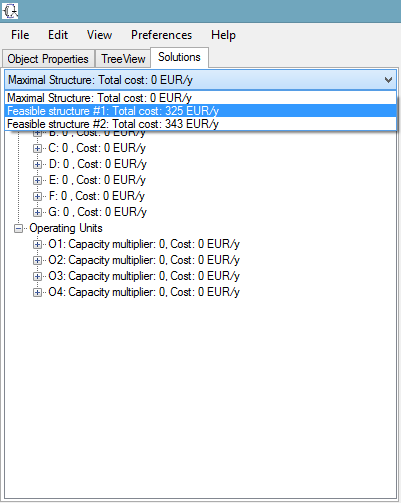
Choosing a solution, You can see the structure by disabled elements given with gray color. The properties (i.e. the quantities, prices, etc.) of the elements of a chosen solution can be seen on the “Solutions” panel.
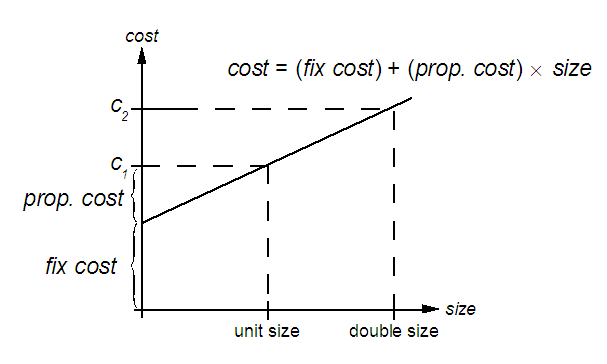
Steps of the calculation:
- Calculate or estimate cost c1 of the operating unit of unit size (defined by the flowrates of input and output materials)
- Calculate or estimate cost c2 of the operating unit of double size (defined by double flowrates of input and output materials)
- proportionalcost = c2 − c1
- fixcost = c1 − proportionalcost
Course #1: Modelling Production Systems
Schedule: Available in each autumn semester at the University of Pannonia
Content: During the course students get acquainted with basic methods and tools for optimization problems of producing systems and supply chains. During the training they can acquire skills in applying graph algorithms, linear mathematical programming, process-network synthesis, and batch process scheduling.
Course #2: Optimization in Engineering Systems
Schedule: Available in each spring semester at the University of Pannonia
Content:The subject provides practically applicable knowledge in design and optimization of industrial production systems. Topics involve:
- Mathematical programming models and methods for algorithmic process synthesis and optimization
- Conceptual design of supply-chains
- Separation-network synthesis
- Vehicle routing
- Vehicle scheduling
- Multi-period production planning
- Optimization under uncertainties
- Maintenance planning
- Disaster recovery planning
Course #3: Analysis and Synthesis of Engineering Systems
Schedule: Available for PhD students at the University of Pannonia
Content: The subject introduces brand recent techniques for the analysis and synthesis of complex systems, and their applications to design and operation planning of large scale industrial production processes. Students gain deep knowledge in process optimization through industrial examples. They acquire such theoretical basics as the combinatorial accelerated branch and bound algorithm, combinatorial foundations of separation-network synthesis, and the details of scheduling theory.
| Prof. Dr. Ferenc Friedler DSc | friedler.ferenc@itk.ppke.hu | |
| Dr. Botond Bertok PhD | bertok@dcs.uni-pannon.hu | +36 88 624 613 |
| Dr. Istvan Heckl PhD | heckl@dcs.uni-pannon.hu | +36 88 624 708 |
| Dr. Tibor Holczinger PhD | holczinger@dcs.uni-pannon.hu | +36 88 624 000 |
| Dr. Zoltan Kovacs PhD | kovacs@dcs.uni-pannon.hu | +36 88 624 613 |
| Dr. Zoltan Sule PhD | sule@dcs.uni-pannon.hu | +36 88 624 710 |
| Janos Baumgartner, PhD student | baumgartner@dcs.uni-pannon.hu | +36 88 624 000 |
| Marton Frits, PhD student | frits@dcs.uni-pannon.hu | +36 88 624 706 |
| Eva Konig, PhD student | konig@dcs.uni-pannon.hu | +36 88 624 706 |
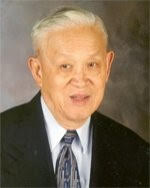
Dr. Liang-tseng “L.T.” Fan (1929-2014) was Head of the Department of Chemical Engineering, Durland Hall at Kansas State University in Manhattan, USA.
A native of Taiwan, Dr. Fan received a B.S. from National Taiwan University (1951), an M.S. from Kansas State University (1954), and a Ph.D. from West Virginia University (1957), all in Chemical Engineering, and an M.S. in Mathematics from West Virginia University (1958). He returned to the Department of Chemical Engineering at Kansas State as Instructor in 1958, became Full Professor in 1963, served as Department Head for 30 years beginning in 1968, and was appointed University Distinguished Professor in 1984.
In cooperation with Dr. Ferenc Friedler, Dr. Fan is considered as the founder of the P-graph framework for Process-Network Synthesis first published in 1991. Nowadays P-graphs are applied worldwide for design and optimization of complex systems and processes ranging from reaction-pathway identification to evacuation route planning.
Dr. Fan was the Mark H. and Margaret H. Hulings Chair in Engineering and Director of the Institute for Systems Design and Optimization at Kansas State University. Dr. Fan was also Managing Partner, Solidiwaste Technology, L. P., President of Liquefied Fossil Fuels Corporation, President of Heartland Composites Development Corporation, and President of The SF Materials Corporation.
In addition, Dr. L. T. Fan was Co-Chairman (Research and Development) of Green Source Holdings LLC and developed the patented technology behind the company. As Co-Chairman, Dr. Fan oversaw the company’s continuing R&D efforts to expand the use of the technology in hydrocarbon extraction.
Dr. Fan has authored or coauthored seven books, some of which have been translated into foreign languages; several hundred refereed journal articles; and many non-refereed articles. He is credited with 17 patents. Dr. Fan’s publications are widely referenced as evident from more than 6,000 citations listed in Science Citation Index.
Dr. Fan has received numerous awards and honors. He was a Fellow of the American Institute of Chemical Engineers and the American Association for the Advancement of Science.